

Over the weekend, I have been experimenting on compacting everything I have understood about futures positioning into a one-liner read per contract. Impact of weekly change in OI (#contracts), flow initiators, flows of commercial - noncommercial and extracting the dynamics for reading financial futures which flows are often not quite symmetrical. And, connecting the dots on the longer-term flows and the week-over-week flows. Today’s dashboard therefore could look a little different from the usual.
Regardless, let’s start with the usual : The weekly read for 07-21-26.
—
RATES
Source : CoT Reports, and Positioning Read Tool by Pord.
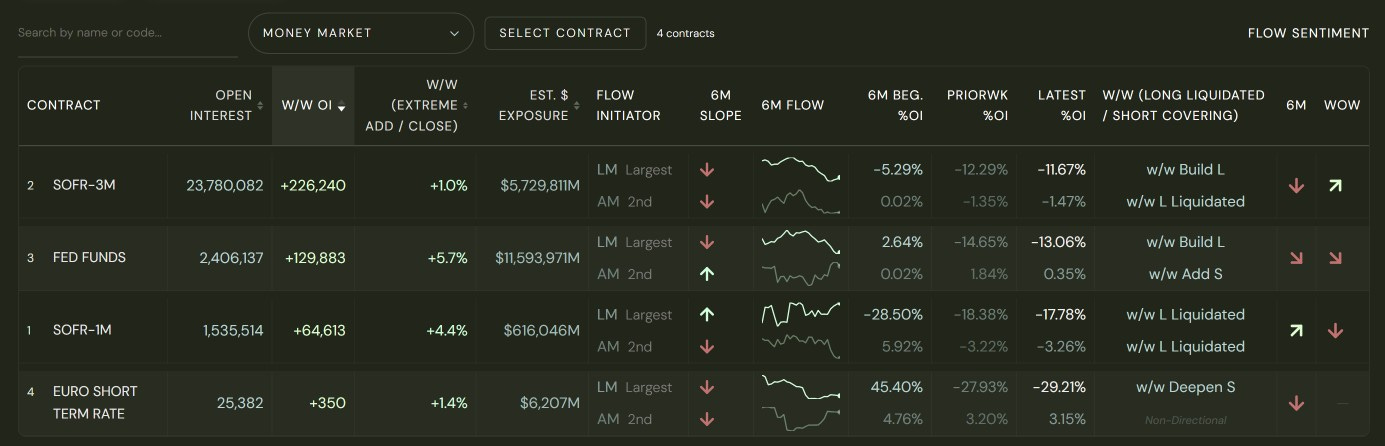
Longer term flows between 3-Month SOFR and Fed Funds futures have shown different dynamics. For 3-Month SOFR : Both flows from LM and AM have been moving likely in the same direction over the past 6M while EFFR futures have been more symmetrical.
Longer term SOFR flows have also been tilting downward. Week-over-week on the other hand, LM built longs more than AM closed longs, leaving the flow mix with a slight upward tilt.
For EFFR futures, more symmetrical in their positioning between AM and LM led to a commercial : non-commercial dynamics in commodities futures. As commercial hedge could be a way to preserve the underlying value in hedger’s portfolio, activity in futures therefore likely to coincide with changes in exposure, price level, and uncertainty in the underlying. More upside. More Risk. More Hedge.
Week-over-week flows of Fed funds futures contracts were mixed and tilted less positive, as AM added shorts more than LM added longs.
Adding more context to the topic, leading up to this week FOMC meeting, the probabilities of interest rate to add 25bsp has been increasing.
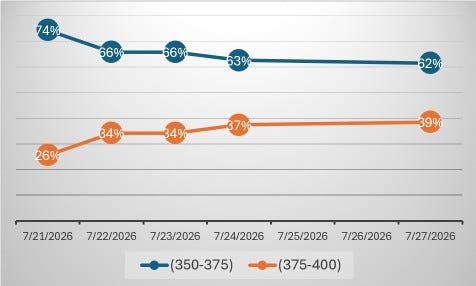
Source : CME Group
Further out to the September meeting, the probabilities of 25bsp increased were maintained around 55% since 07-21-26. The probabilities of 25 bsp increased derived from of 3-Month SOFR have now at 84.6%.
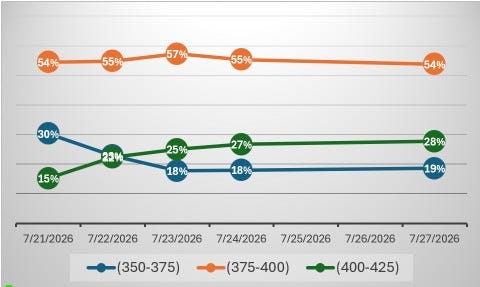
Source : CME Group
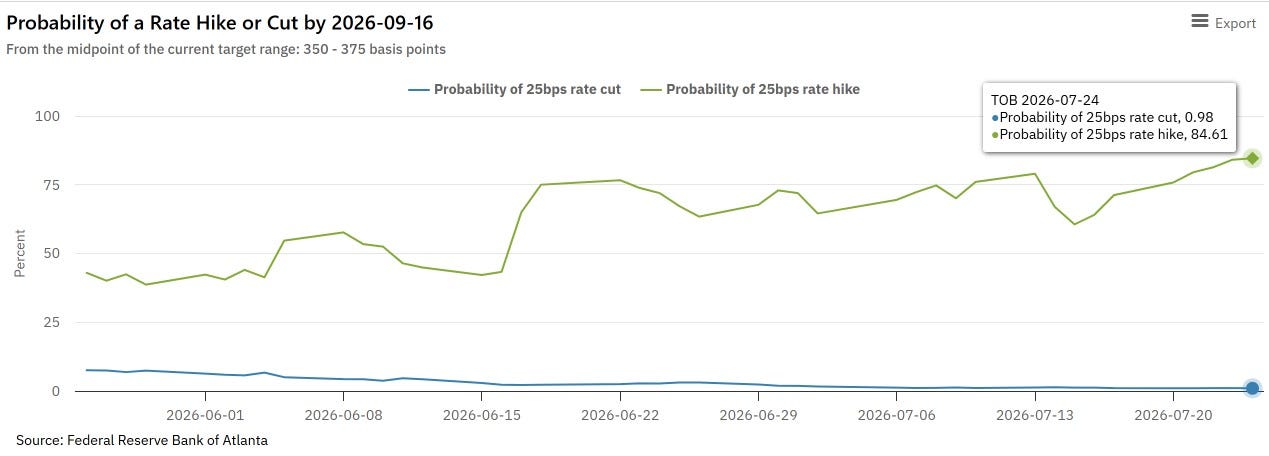
Source : Atlanta Fed
—
TREASURIES
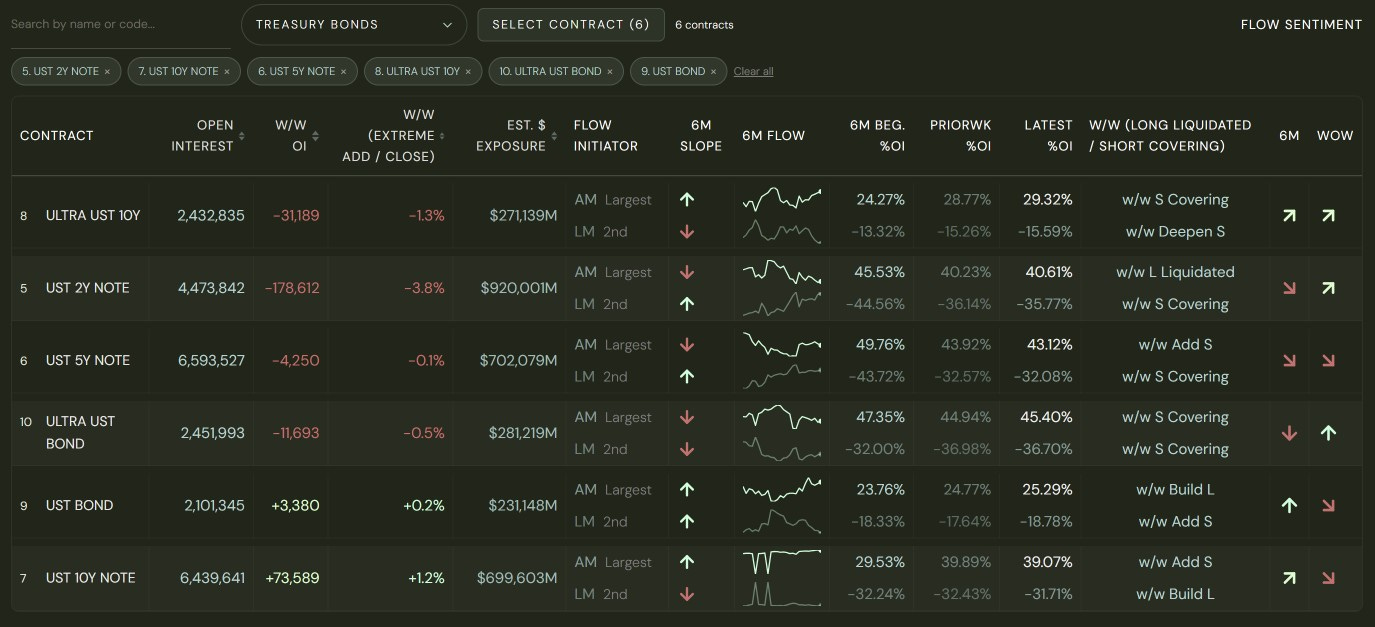
Source : CoT Reports, and Positioning Read Tool by Pord.
2s- 10s - 5s - 30s Dynamics :
The dynamics between AM and LM on treasuries futures have also been broadly symmetrical. Over the past six months, their flows tended to converge and diverge together.
Ultra 10s and 30s in particular, flows tend to look symmetrical and have moved in the same direction, likely reflecting more precise positioning on this precisely 10s and the 30s futures. More context to the topic, applying a view of a commercial hedge to the treasuries positioning(s) can be more thorough when considering the risk management role of futures as maintaining the level of exposure (not reducing) or keeping good balance of durations between the asset side and the liability side without having to take actual cash exposure on the underlying.
What this means is that commercial positioning can align with either direction in the underlying price. Studying specific timeframes for recurring patterns may add context for when positioning is more informative about one price direction versus the other.
Over the past six months, AM positioning in 2s and Ultra10s appears to have unwound.
w/w : LM closed shorts on 2s-10s and drove flows, tilt positive.
Pord. api : positioning context also available as metrics for download.
—
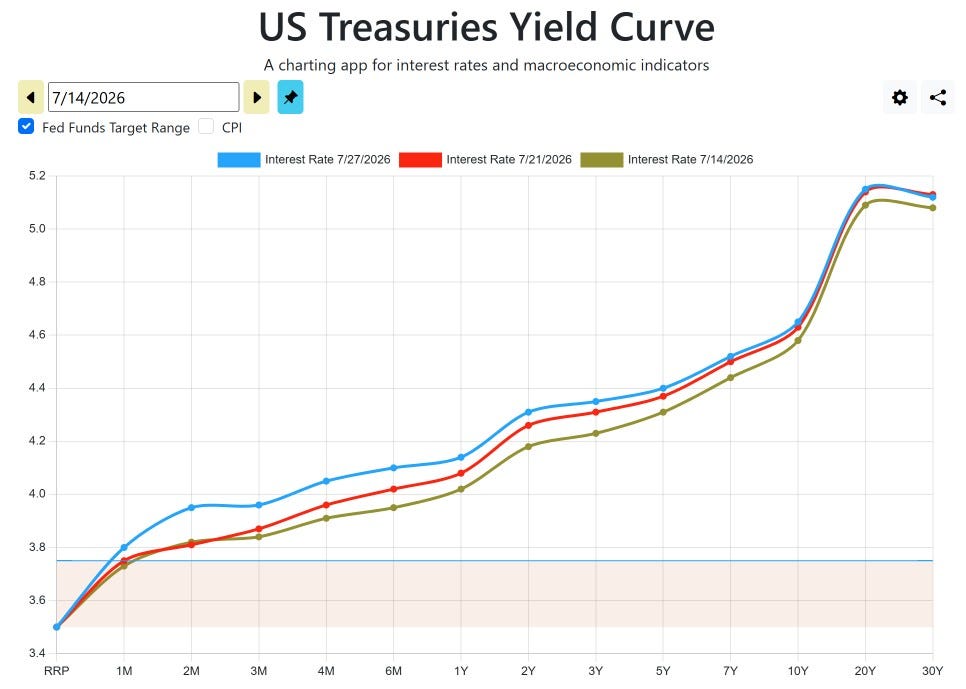
After 07-21-26, the curve flied up even further at the shorter end of the curve.
—
EQUITIES
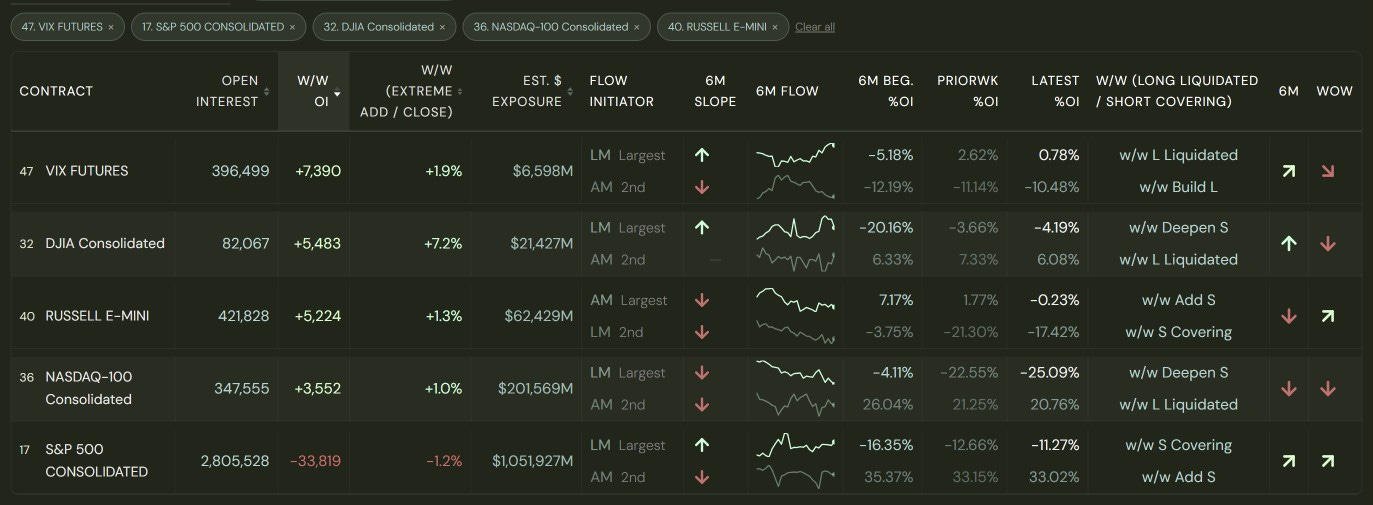
SP500 tilt positive largely from LM short coverings.
Longer term flows (over the past 6M) of cyclical beta (Russell2000) and tech beta (Nasdaq100) have in fact been bearish as both dominant cohorts run negative slope.
While the index implies volatility in pricing, open interest can add contexts on how much risk is being warehoused. Over the week, VIX total contracts were added moderately, and LM Long liquidated (close L) drove tactical flows tilted a tad upside to the underlying index. w/w AM continued building long.
SP500 Short covering (close S) and VIX Long liquidated (close L) can be read out as a reset, but with a note on the market remained net short and AM moved in the opposite direction.
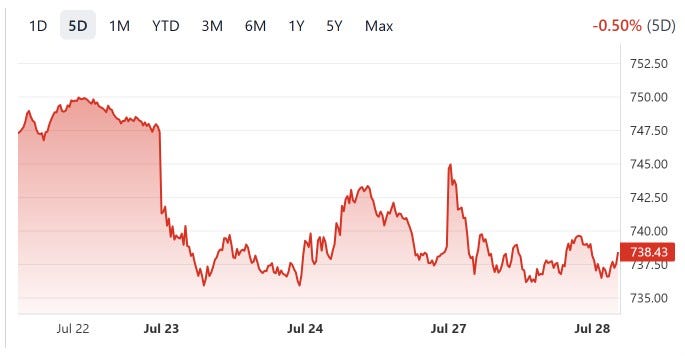
More context on equity markets, after 07-21-26, SP500 has been trending downward.
Source : CoT Reports, and Positioning Read Tool by Pord.
SPY : ETF Proxy
Source : Stock Analysis
Hope you enjoy this quick summary for 3 main asset types. See you in the MID-WEEK DEEP DIVE